
Executive Summary
A direct liquid cooling cold plate can remove the required total heat while still allowing a local chip hotspot. The reason is that overall cooling capacity, local thermal resistance, flow distribution and temperature uniformity are different engineering properties. A cold plate may show an acceptable average temperature while one region receives less coolant, has a longer heat path or carries a higher heat flux.
Microchannel geometry and manifold design determine how coolant reaches the heated surface. Channel dimensions affect wetted perimeter, heat-transfer area, hydraulic resistance, velocity and pressure drop. Manifold pressure gradients, channel-to-channel resistance variation and manufacturing tolerance then determine whether the available flow is distributed as intended. The resulting local heat-transfer coefficient and thermal resistance govern chip-surface temperature, not total flow alone.
This article focuses on uniformity inside a single cold plate. It treats the problem as a coupled thermal-hydraulic design and validation task: define the local flow path, predict the local thermal resistance, measure the temperature field and separate simulation results from test evidence.
Microchannel Geometry and Thermal Resistance
Microchannel width, depth, length, hydraulic diameter, spacing and fin thickness jointly control the wetted perimeter and heat-transfer area available to the coolant. Hydraulic diameter describes the characteristic flow dimension of a non-circular passage; it affects velocity distribution and hydraulic resistance when geometry and flow rate are fixed. Channel arrangement and inlet or outlet manifold geometry determine how those passages are fed.
Reducing channel dimensions can increase area density and may increase local heat transfer, but it also raises hydraulic resistance and sensitivity to dimensional tolerance. A longer channel can provide more contact area while accumulating more pressure loss. Thinner fins can reduce the spreading distance from a heat source to the coolant but may reduce mechanical margin and increase manufacturing sensitivity. More channels can improve spatial resolution of heat removal, yet add inspection and fabrication complexity.
The design question is therefore not whether smaller channels are always better. It is whether the selected geometry provides the required local thermal resistance and flow uniformity within the available pressure drop, coolant property range, manufacturing tolerance and maintainability envelope.
Microchannel resistance and heat-transfer behavior also depend on coolant viscosity, temperature, flow regime and total flow rate. A geometry result obtained with one coolant property set must not be transferred to another coolant or operating condition without a new calculation or test.
Table I: Microchannel Geometry and Thermal-Hydraulic Trade-Offs
|
Geometry parameter |
Heat-transfer effect |
Pressure-drop tendency |
Flow-uniformity tendency |
Main engineering limitation |
| Channel width | Changes wetted perimeter and area density | Often increases as width decreases | Sensitive to tolerance and manifold coupling | Fabrication and blockage consequence |
| Channel depth | Changes flow area and heat path | Increases when passage becomes shallow | May amplify channel resistance variation | Base thickness and mechanical margin |
| Channel length | Longer contact path can add heat-transfer area | Accumulates loss along passage | Long channels are more sensitive to inlet pressure gradient | Footprint and thermal gradient |
| Hydraulic diameter | Influences velocity and local coefficient | Smaller diameter generally raises resistance | Can magnify channel-to-channel mismatch | Coolant property and tolerance sensitivity |
| Fin thickness and spacing | Controls spreading path and area density | Tighter spacing restricts flow | May improve or reduce uniformity depending on manifold | Strength, machining and inspection |
| Channel arrangement | Sets heat-source coverage | Turns and transitions add local loss | Poor layout can create low-flow zones | Complex design verification |
This comparison is qualitative. Any numerical dimension, heat-transfer coefficient or pressure-drop value must be identified as an illustrative engineering example under a defined coolant, heat load, flow rate and test condition.
Flow Distribution Inside the Cold Plate
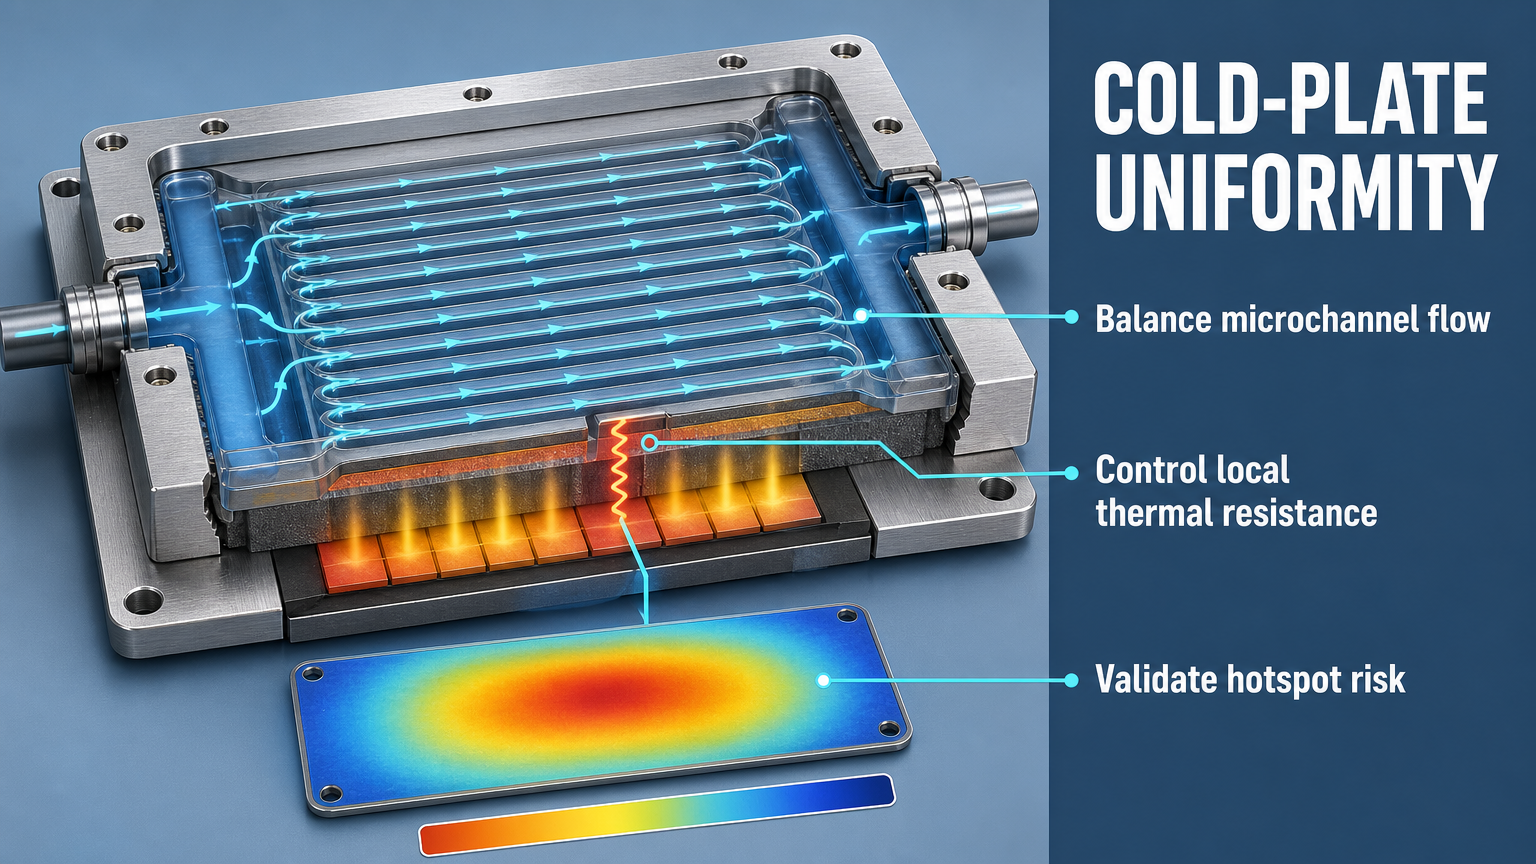
Inside a cold plate, an inlet manifold supplies parallel microchannels and an outlet manifold collects the flow. Flow maldistribution occurs when channel flow rates differ from the intended design. A channel receives flow according to its pressure differential and hydraulic resistance; it does not receive an equal share simply because the channels are drawn with equal nominal dimensions.
A manifold pressure gradient can make channels near one region see a different driving pressure from channels farther away. Channel length variation, dimensional tolerance, local blockage and viscosity variation change individual resistance. Inlet and outlet placement can create entrance effects, recirculation or dead zones. At low total flow, these differences may become more visible because the available pressure differential is smaller; at high flow, the manifold gradient and local losses can become more significant.
The thermal consequence is local. A low-flow channel has lower coolant velocity and may provide a lower local heat-transfer coefficient. If that channel lies beneath a high heat-flux region, local thermal resistance increases and a hotspot may form even while total flow and average coolant temperature remain acceptable.
Table II: Causes of Flow Maldistribution Inside Cold Plates
|
Cause |
Local hydraulic effect |
Thermal consequence |
Detection method |
Possible design response |
| Manifold pressure gradient | Different channel driving pressure | Uneven local heat-transfer coefficient | Pressure taps and flow mapping | Balance manifold area and path |
| Channel length variation | Different channel resistance | Region-dependent temperature rise | Dimensional inspection and flow test | Tighten layout and tolerance |
| Local blockage | Reduced passage area and local loss | Hotspot or unstable local cooling | Flow comparison and inspection | Control cleanliness and passage margin |
| Manufacturing tolerance | Channel resistance mismatch | Repeatability loss across plates | CT, microscopy or dimensional check | Tolerance analysis and sampling |
| Inlet and outlet layout | Entrance loss or recirculation | Low-flow region near heat source | Visualization or pressure mapping | Redesign transition and manifold |
| Coolant viscosity variation | Resistance changes with temperature or fluid state | Flow distribution shifts with condition | Property measurement and test logging | Design across property envelope |
| Recirculation zone | Local flow separation or stagnant region | Reduced local heat removal | Flow visualization or CFD correlation | Smooth transitions and corners |
| Entrance effect | Developing velocity profile | Non-uniform local coefficient | Spatial temperature mapping | Provide sufficient entrance control |
Flow distribution must be interpreted together with the heat-flux map. A small hydraulic imbalance beneath a low-power region may have little thermal effect, while the same imbalance beneath a concentrated chip hotspot can dominate the temperature field.
Thermal Uniformity and Hotspot Formation
Thermal uniformity describes how evenly temperature is distributed across the relevant cold-plate or chip surface. Local thermal resistance is the temperature difference between a local heat source and the coolant path divided by the local heat flow, with the exact definition set by the project measurement model. It includes conduction through the base, thermal spreading, the chip-to-cold-plate interface and local convection to the coolant.
Thermal-resistance comparisons require a stated reference pair and heat-flow basis. Depending on the project, the reported quantity may be junction-to-coolant, case-to-coolant, chip-surface-to-coolant or cold-plate-base-to-coolant. The reference surfaces must be stated before values from different designs are compared.
The cold-plate inlet is not automatically the coldest region, and the outlet is not automatically the hottest. The actual pattern depends on local heat flux, channel flow, manifold pressure, base thickness, spreading path and interface resistance. A high heat-flux region near an inlet may remain hot if it is poorly covered by channels or has a long spreading path. A downstream region may remain relatively cool if its local heat load is low or its channel flow is strong.
Temperature measurement also has limits. Embedded sensors measure specific points; infrared thermography measures an apparent surface temperature affected by emissivity, surface finish, viewing angle, reflection and calibration. A single sensor or average value cannot prove uniformity. The test must map locations that matter thermally and record the heat load and coolant condition at the same time.
Testing and Validation
Cold-plate uniformity should be verified through complementary tests rather than one instrument. Infrared thermography can reveal spatial patterns when emissivity and reflections are controlled. Embedded sensors provide repeatable point measurements. Inlet and outlet temperature measurements establish the integrated heat pickup, while pressure-drop and flow measurements identify the hydraulic operating point. Channel-level flow measurement or validated flow visualization can investigate maldistribution directly.
Steady-state thermal mapping identifies persistent spatial differences. A step-load thermal test shows whether a local region responds differently when heat flux changes. Pressure and leakage testing confirms the pressure boundary but does not by itself prove thermal uniformity. Simulation can guide sensor placement and identify expected low-flow zones, but simulated temperature fields must remain separate from measured results.
CFD results are design predictions. When used for flow or temperature uniformity, they require CFD-to-test correlation under defined boundary conditions, material properties, mesh assumptions and sensor locations. A simulation field alone does not prove cold-plate uniformity.
Table III: Thermal Uniformity Validation Methods
|
Method |
Measurement target |
Main advantage |
Main limitation |
Suitable application stage |
| Infrared thermography | Surface temperature field | High spatial coverage | Emissivity and reflection sensitivity | Prototype mapping and fault review |
| Embedded temperature sensors | Selected local temperatures | Repeatable point data | Limited spatial coverage | Design verification and monitoring |
| Inlet and outlet temperature | Integrated coolant heat pickup | Simple system-level measurement | Cannot identify local hotspot | Every validation stage |
| Pressure-drop measurement | Cold-plate hydraulic loss | Defines operating point | Does not prove flow uniformity | Design and acceptance testing |
| Flow distribution measurement | Channel or region flow | Direct maldistribution evidence | More difficult instrumentation | Prototype and design validation |
| Steady-state thermal mapping | Persistent temperature uniformity | Clear comparison across locations | Requires thermal stabilization | Acceptance and characterization |
| Step-load thermal testing | Transient local response | Shows local dynamic sensitivity | Requires controlled heat-load input | System integration and stress testing |
The test record should include heat load, coolant inlet and outlet temperature, total flow, pressure drop, ambient temperature, local surface temperatures, uniformity metric, test duration, coolant properties, measurement positions and instrument uncertainty. Without those conditions, a reported temperature difference is not transferable to another cold plate.
Pressure-boundary integrity does not prove thermal uniformity. Pressure and leakage testing, flow-distribution testing and thermal mapping answer different validation questions and should be reported separately.
Design Trade-Offs and Engineering Selection
Cold-plate selection is a multi-objective decision. Higher flow can reduce local coolant temperature rise and improve heat transfer, but it increases pumping demand and may increase pressure loss. Smaller channels can increase area density, but they are more sensitive to tolerance and blockage. More channels can improve heat-source coverage while increasing fabrication and inspection complexity.
A thinner base can reduce spreading resistance but may reduce mechanical strength or increase deformation sensitivity. A larger heat-transfer area may lower local thermal resistance while increasing flow resistance and package size. A more uniform temperature field may require a more complex manifold or a larger footprint. The preferred design is therefore the one that satisfies the local thermal, hydraulic, manufacturing, maintenance and validation requirements together—not the one that optimizes a single average value.
Cold-Plate FMEA and RPN Analysis
The following risk ranking is an illustrative engineering assessment. It is not a universal safety limit, certification result or field-failure statistic. Any project RPN must use a documented Severity, Occurrence and Detection scale and should use the project-required Action Priority method where applicable.
Table IV: Cold-Plate FMEA and RPN Analysis
|
Failure mode |
Cause |
Local effect |
System effect |
Detection method |
Illustrative RPN |
Corrective action |
| Uneven channel flow | Manifold gradient or resistance mismatch | Local coefficient variation | Temperature non-uniformity | Flow mapping and thermal map | 160 | Balance manifold and verify |
| Local blockage | Debris, deformation or restricted passage | Reduced local flow | Hotspot or derating | Pressure, flow and inspection | 180 | Increase margin and control cleanliness |
| Excessive pressure drop | Small passages, long path or high viscosity | Reduced available flow | Pump operating limit | Pressure-drop test | 150 | Review geometry and operating envelope |
| Local hotspot | High heat flux and local resistance | Temperature limit exceeded locally | Chip protection response | Thermal imaging and sensors | 185 | Improve coverage and interface path |
| Thermal interface resistance | TIM thickness, void or contact variation | Higher local temperature | Reduced thermal margin | Interface inspection and thermal test | 170 | Control assembly and TIM process |
| Channel deformation | Pressure, thermal or mechanical load | Changed passage resistance | Flow shift and reliability loss | Dimensional inspection and retest | 155 | Increase structural margin |
| Sensor misplacement | Poor location or reference error | False uniformity assessment | Undetected hotspot | Sensor-location review | 145 | Define measurement map |
| Incomplete validation | Insufficient heat-load or flow cases | Unknown local behavior | Unverified reliability | Test-plan audit | 190 | Expand controlled validation |
FMEA is a risk-organization tool, not proof that a cold plate is uniform. High-priority actions should become measurable design checks, dimensional inspections, flow tests, thermal maps and documented acceptance criteria.
Conclusion
Cold-plate performance is a coupled thermal-hydraulic problem. Overall cooling capacity and average temperature are necessary indicators, but they are insufficient to prove local temperature uniformity or hotspot resistance. Microchannel geometry, manifold pressure, channel resistance, heat-flux distribution, base thickness and interface resistance must be evaluated together.
A defensible design verifies microchannel flow distribution, local thermal resistance, chip-surface temperature uniformity, inlet-to-outlet temperature difference, pressure drop, manufacturing tolerance and long-term operating stability. The most reliable selection is not defined by the smallest channel or the highest total flow. It is defined by a measured and repeatable thermal-hydraulic envelope that protects the hottest local region.
Engineering FAQ
Q:What causes flow maldistribution inside a cold plate?
A:Flow maldistribution is caused by unequal pressure differences or hydraulic resistance among parallel microchannels. Manifold pressure gradients, channel length variation, dimensional tolerance, inlet and outlet layout, blockage, recirculation and coolant viscosity changes can all shift the local flow split.
Q:How does microchannel geometry affect thermal resistance?
A:Width, depth, hydraulic diameter, length, fin thickness and spacing affect wetted perimeter, heat-transfer area, velocity, local heat-transfer coefficient and pressure drop. Smaller passages may improve area density, but they can also increase resistance, tolerance sensitivity and blockage consequence.
Q:Why can a cold plate develop local hotspots when average temperature is acceptable?
A:Average temperature hides local behavior. A high heat-flux region may coincide with low channel flow, a long spreading path, greater base thickness or increased interface resistance. The integrated coolant temperature can remain acceptable while one chip region exceeds its thermal margin.
Q:How should cold-plate thermal uniformity be validated?
A:Use complementary evidence: controlled heat load, inlet and outlet coolant temperatures, total flow, pressure drop, local sensors, infrared thermography or thermal mapping, and flow-distribution measurements where possible. Record measurement location, emissivity, coolant properties, duration and instrument uncertainty.
Q:What is the trade-off between smaller channels and higher pressure drop?
A:Smaller channels can increase wetted perimeter and heat-transfer area, but they usually increase hydraulic resistance and sensitivity to manufacturing variation. They may also make blockage more consequential. The correct size is the one that meets local thermal resistance and flow-uniformity requirements within the pressure and manufacturing envelope.
Q:Which parameters should be recorded during cold-plate testing?
A:Record heat load, coolant inlet and outlet temperature, total flow, pressure drop, ambient temperature, local surface temperatures, temperature-uniformity metric, test duration, coolant properties, measurement locations and test method. Separate measured results from simulation predictions.
Post time: Aug-18-2026