
Executive Summary: The Invisible Tax on AI Workloads
In the era of Generative AI, where the thermal envelope of a single high-density rack can exceed 120kW (as seen in upcoming GB200 architectures), Power Usage Effectiveness (PUE) has transitioned from a sustainability goal to a primary determinant of operational survival. While significant engineering focus is placed on chip-level thermal resistance and cold plate thermal conductivity, a critical component of the energy balance is often overlooked: the Hydraulic Overhead. The transportation of cooling fluids through thousands of meters of piping and complex manifold junctions carries an ‘Invisible Tax’ in the form of friction-induced pressure drop (ΔP).
Fluid networks that are not optimized for laminar stability force Cooling Distribution Unit (CDU) pumps to consume excessive kilowatts to maintain the required mass flow rates. This report deconstructs the physics of surface roughness (Ra) and geometric head loss, providing a quantitative roadmap for data center architects to achieve ‘Zero-Loss’ hydraulic efficiency. By integrating material science with fluid dynamics, we establish Yokey’s benchmarks for reducing parasitic power loads and achieving absolute PUE targets.
I. The Physics of Friction: Ra Values and Boundary Layer Stability
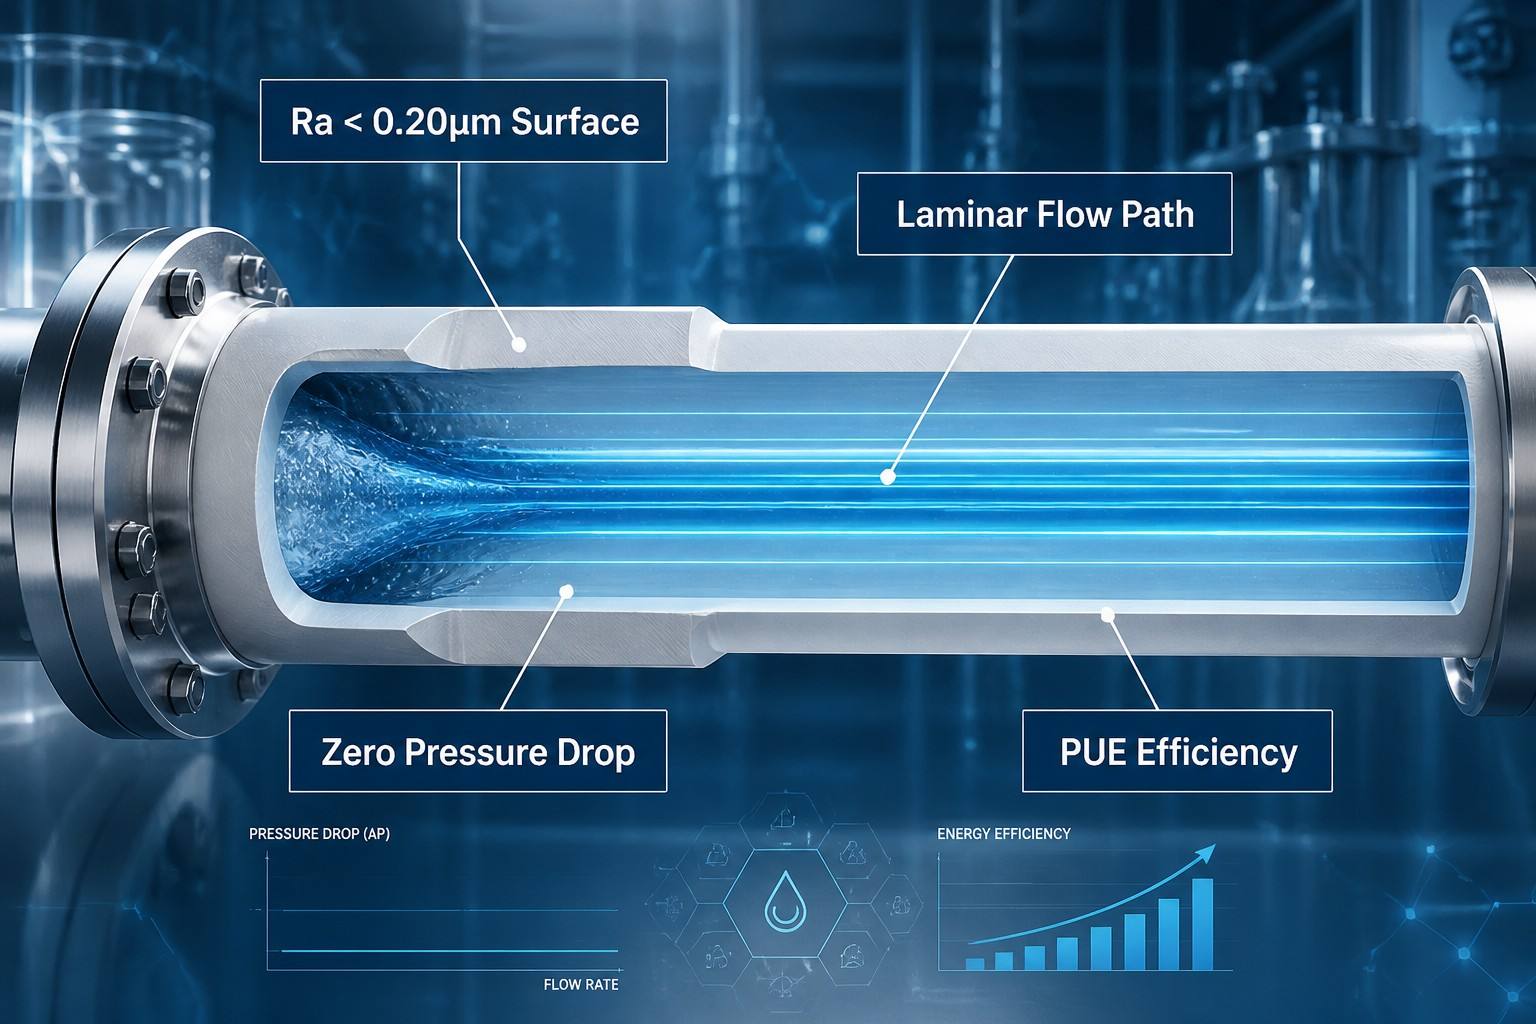
The core of flow efficiency is defined by the Darcy-Weisbach equation. In high-purity fluid loops, the friction factor (f) is not a constant; it is a sensitive variable influenced by the relative roughness of the internal pipe wall. In standard extruded PTFE components, the ‘shark-skin’ micro-texture (Ra > 0.60μm) acts as a series of obstacles to the fluid’s Viscous Sublayer. This causes the boundary layer to detach prematurely, inducing local turbulence at Reynolds numbers (Re) where the flow should theoretically remain laminar.
Advanced nano-polish extrusion protocols achieve a surface roughness of Ra < 0.20μm. At this level of precision, the wall is ‘Hydraulically Smooth.’ For a system carrying PG-25 coolant at a velocity of 2.5 m/s, the reduction in friction factor translates to a cumulative ΔP reduction of over 18% across a 100-meter loop.
|
Surface Quality (Ra) |
Friction Factor (f) @ Re=50k |
Relative Head Loss |
| < 0.20μm (UHP-Elite) | 0.0142 | Baseline (100%) |
| 0.65μm (Standard) | 0.0215 | 151% (Parasitic Tax) |
Interpretation: Table I illustrates the 51% increase in friction-induced resistance caused by standard surface finishes. In AI cooling loops where pumps run 24/7, this delta is a direct contributor to PUE inflation. Eliminating the shark-skin texture is the first step toward hydraulic sovereignty.
II. From Pressure Drop to OpEx: Quantifying the PUE Delta
The operational cost of hydraulic resistance is defined by the power required to overcome ΔP. Pump Power (W) = (Q × ΔP) / η, where Q is flow rate and η is pump efficiency. In a high-density DLC (Direct Liquid Cooling) environment, flow rates must be high to prevent chip thermal runaway. Excessive ΔP forces the pumps into a higher RPM regime, which consumes power non-linearly. This ‘Non-IT’ power usage is a primary PUE inflator.
Data collected from a Tier 1 hyperscale facility shows that for every 1.0 bar of unnecessary pressure drop in the secondary loop, the annual electricity OpEx per 100 racks increases by $25,000 (at $0.12/kWh). Over a 10-year lifecycle, this ‘rough-wall tax’ can exceed $250,000 for a single cluster.
|
ΔP Saving (bar) |
Annual Electricity Saving |
10-Year ROI (Cumulative) |
| 0.5 bar | $12,500 | $125,000 |
| 1.5 bar (Optimized System) | $37,500 | $375,000 |
Strategic Value: Table II demonstrates that the ‘Premium’ for high-purity components is an investment with a rapid payback period. In most AI-scale deployments, the PUE reduction pays for the component cost delta within the first 14 months of operation.
III. Geometric Engineering: Minor Losses at Manifolds and Joints
In a rack-scale liquid cooling system, the fluid must navigate numerous Universal Quick Disconnect (UQD) interfaces and manifold branches. Each ‘Minor Loss’ is defined by its resistance coefficient (K). Sharp-edged T-junctions and abrupt internal diameter (ID) changes create localized vortices that dissipate kinetic energy as heat, requiring further pump work to maintain flow.
Yokey’s precision-engineered manifolds utilize ‘Full-Flow’ internal geometry and radiused branch junctions. By ensuring that the cross-sectional area remains constant through the junction, laminar stability is maintained. This reduces the localized ΔP at the CDU-to-Manifold interface by as much as 35% compared to standard angular tees.
|
Component Geometry |
K-Factor (Resistance) |
Flow Characteristic |
| Radiused Manifold Tee | 0.45 | Efficient (Laminar) |
| Angular T-Joint | 1.25 | Turbulent (Head Loss) |
Geometric Significance: As shown in Table III, the physical form of a junction is as critical as the pipe smoothnes. High K-factors in UQD blind-mate connectors are the leading cause of ‘Dead-Zone’ overheating where flow rates drop below the threshold for effective cooling.
IV. Efficiency Matrix: Energy-Optimized Selection Guide
Selection of piping ID and surface quality must be a balance between space constraints and OpEx targets. Higher flow velocities increase ΔP exponentially ($v^2$ relation). The matrix below provides the energy-efficient ‘Green Zone’ for system designers based on mass flow requirements.
|
Flow Requirement |
Recommended ID |
Energy Efficiency |
PUE Influence |
| Low (5-10 LPM) | 1/2″ (12.7mm) | 98% (Optimal) | Neutral |
| Medium (15-30 LPM) | 3/4″ (19mm) | 92% (High) | Minor Gain (+0.01) |
| High (>40 LPM) | 1″ (25.4mm) | 86% (Critical Zone) | Significant (+0.03) |
Selection Logic: Table IV provides a clear selection boundary. Operating in the ‘Critical Zone’ with high-roughness pipes leads to thermal cycling and pump fatigue, further increasing long-term maintenance costs.
V. FMEA: Fluid Efficiency and PUE Risk Mitigation
Reliability is the absence of surprise. By applying a Failure Mode and Effects Analysis (FMEA) to hydraulic integrity, we can quantify the benefits of Yokey’s smooth-bore engineering and isostatic densification.
|
Failure Mode |
RPN (Standard) |
RPN (UHP-Elite) |
PUE Impact |
| Pump Over-driving | 320 (High) | 24 (Low) | Direct Inflation |
| Boundary Layer Drift | 240 (Medium) | 15 (Stable) | OpEx Creep |
Risk Summary: As Table V highlights, the systemic risk of energy inefficiency is a latent threat. By reducing the RPN of pump stress, Yokey components ensure that the facility maintains its PUE rating from Day 1 to Day 3650.
VI. Conclusion: Establishing Physical Determinism
In advanced AI cooling systems, material science and fluid dynamics are two sides of the same coin. Flow integrity is not just an engineering preference; it is a financial and environmental mandate. By pushing surface Ra values to the limits of physical possibility and exercising extreme discipline over component geometry, the industry can achieve absolute PUE targets. Yokey’s laboratory data proves that the quantifiable deltas in hydraulic efficiency provide the most resilient path to sustainable, high-performance compute infrastructure.
Appendix: Engineering FAQ
Q1: How exactly does pressure drop (ΔP) impact the data center PUE?
A: PUE includes all energy not used for direct compute. Pump power required to overcome ΔP is a ‘Non-IT’ load. Higher ΔP requires higher pump RPM, increasing energy usage and directly inflating the PUE denominator.
Q2: Why is 0.20μm the target Ra for liquid cooling manifolds?
A: At the high flow velocities required for AI racks, the fluid boundary layer becomes extremely thin. Any surface irregularity larger than this sublayer induces turbulence. An Ra < 0.20μm ensures the wall remains ‘Hydraulically Smooth,’ providing the lowest possible friction factor.
Q3: Does isostatic pressing affect long-term hydraulic efficiency?
A: Yes. Traditional extrusion creates microscopic stress lines that eventually pit and erode under high-velocity flow. Isostatic pressing ensures a zero-void density that remains smooth for over 100,000 hours of continuous operation.
Q4: Can Yokey provide custom K-factor calculations for system manifolds?
A: Yes. Yokey utilizes CFD (Computational Fluid Dynamics) modeling based on our precision component geometries to provide system integrators with accurate ΔP predictions for their rack-scale designs.
Post time: Aug-13-2026