
Executive Summary: Why Average Compound Data Cannot Prove Local Seal Uniformity
A rubber seal is often accepted by average hardness, tensile strength, elongation and compression set. Those values are necessary for batch screening, but they do not prove that every location in the molded seal has the same filler state or local performance. The same nominal compound can contain filler agglomerates, filler-rich regions, filler-poor regions, cure-density differences, microvoids, weak polymer-filler interfaces and residual stress.
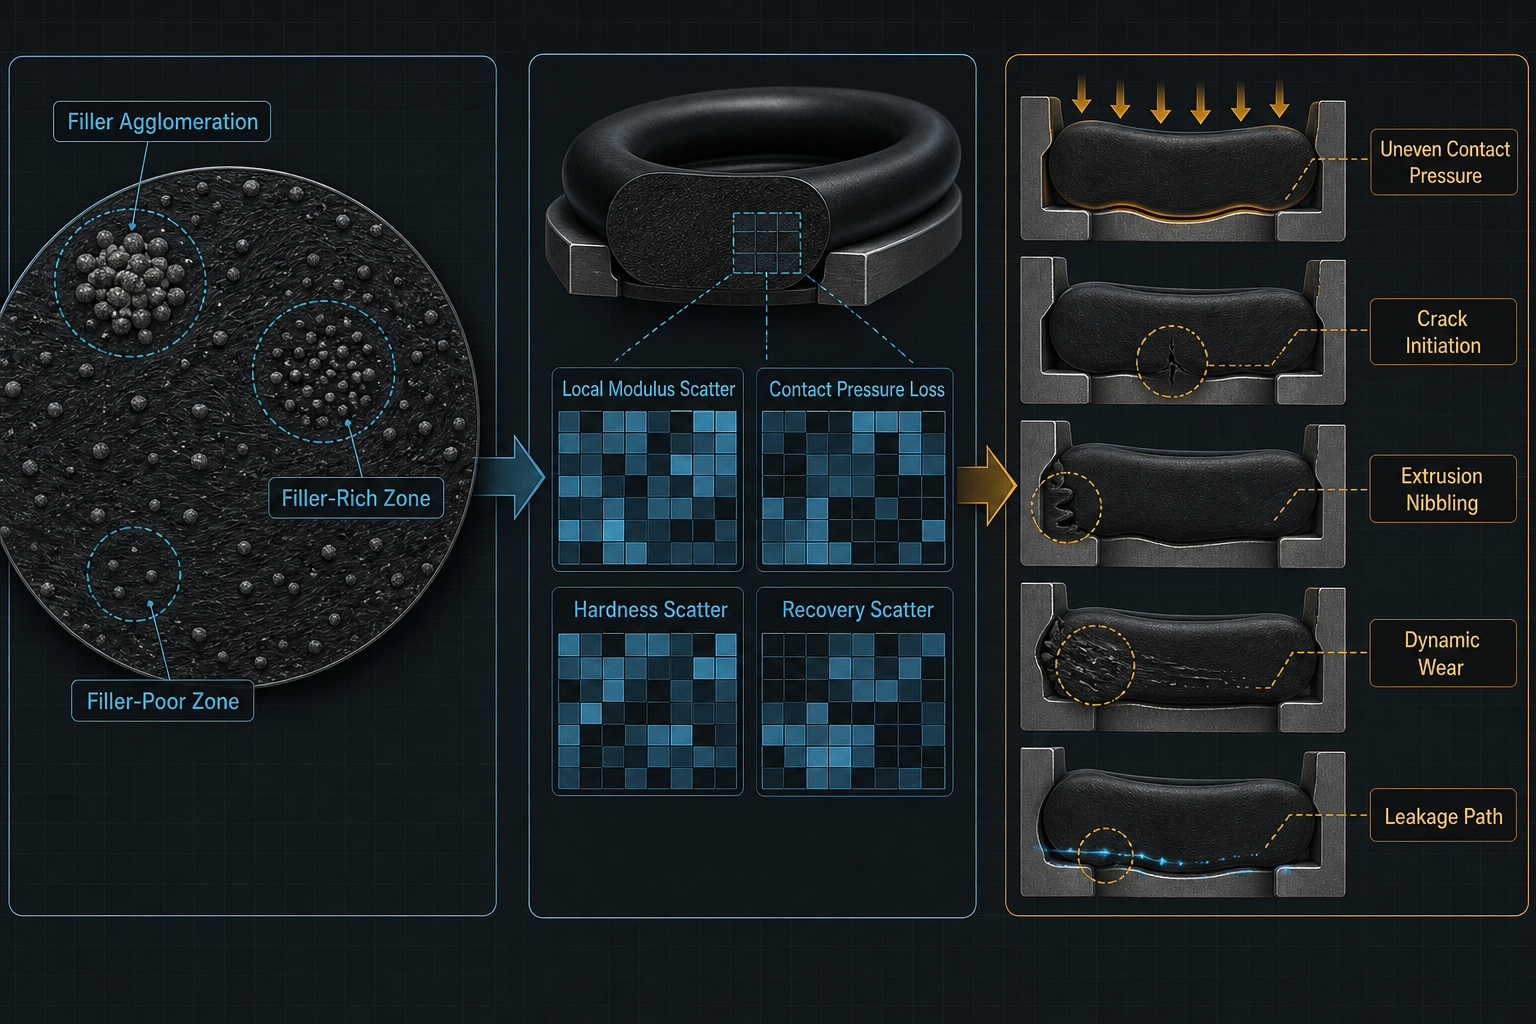
This matters because sealing is local. Contact pressure is created along a narrow interface, and leakage often begins at the weakest segment of that interface, not at the statistical average of the batch. Local high-modulus areas may create pressure peaks, assembly damage or discontinuous contact. Local low-modulus areas may lose recovery, increase extrusion tendency or become a leakage path under pressure cycling. O-rings, rectangular seals, lip seals, gaskets and custom molded profiles amplify these local differences in different ways because their compression state and contact geometry are different.
The central engineering point is straightforward: average filler content, average hardness and average compression set cannot fully represent the local performance variability created by non-uniform filler dispersion. Reliable evaluation must connect microstructural variability, local property testing, seal geometry, contact pressure, finite element analysis where appropriate and finished-seal leakage verification.
Filler Systems and Dispersion Fundamentals: More Than Filler Content
Fillers in rubber seals are not inert volume additions. Carbon black, silica, calcium carbonate, clay or mineral fillers, PTFE or polymeric fillers, graphite or solid-lubricant fillers, short fibers, conductive fillers and thermal-conductive fillers may be used to adjust hardness, modulus, tear strength, wear resistance, friction, media resistance, dimensional stability, conductivity, heat transfer or processing behavior. Functional surface-treated fillers may also be selected to modify polymer-filler interaction.
The presence of filler in a formulation is not the same as uniform filler dispersion. Filler dispersion describes how effectively particles and agglomerates are broken down and embedded in the polymer matrix. Filler distribution describes where filler is located spatially. Filler agglomeration refers to clusters that remain insufficiently separated. Filler-rich regions may be stiff and brittle; filler-poor regions may be soft, weak or extrusion-prone.
Polymer-filler interface quality is equally important. A well-distributed but weakly bonded particle can become a debonding site under compression, sliding or cyclic loading. Filler dispersion therefore involves particle size, agglomerate breakup, surface treatment, interfacial bonding, network formation and spatial uniformity.
Mixing, Processing and Cure Origins of Non-Uniform Dispersion
Non-uniform dispersion often begins before the molded seal exists. Batching error, filler moisture, unstable surface treatment or an unsuitable addition sequence can create local material differences that the mixer cannot fully erase. Insufficient mixing time or shear energy leaves agglomerates. Excessive temperature can change viscosity, scorch margin or additive distribution, while low temperature can limit filler wet-out and polymer flow. Masterbatch and final-mix differences may also produce local concentration gradients.
Processing history continues the problem. Dispersants, plasticizers and processing aids may not distribute uniformly. Mixer wear, roll wear and local temperature differences can change shear history. Filtering can remove foreign matter but may leave local flow marks. Extrusion and preforming can orient particles or fibers. Mold filling may create flow-end structures, knit lines or corner regions with different deformation history.
Vulcanization adds another layer. Cure temperature gradient, cure time difference and section-thickness variation may generate cure non-uniformity that overlaps with filler non-uniformity. Porosity can occur in the same region, but dispersion defects, cure non-uniformity and voids are not the same defect. They require different confirmation methods.
Table 1. Manufacturing Origins of Filler-Dispersion Non-Uniformity
| Process Stage | Potential Cause | Microstructural Result | Local Property Effect | Recommended Control |
| Raw materials | Moisture or surface variation | Poor wetting | Weak interface | Incoming checks |
| Filler addition | Wrong sequence | Early agglomerates | Stiff spots | Controlled loading |
| Mixing | Low shear energy | Incomplete breakup | Modulus scatter | Energy window |
| Master/final mix | Batch mismatch | Concentration gradient | Hardness variation | Traceability |
| Filtering | Contaminant retention | Local inclusions | Crack initiation | Filter monitoring |
| Extrusion/preform | Flow orientation | Directional structure | Anisotropy | Process control |
| Mold filling | Flow-end effect | Local segregation | Weak edge zones | Gate review |
| Vulcanization | Thermal gradient | Cure-density variation | Recovery variation | Cure mapping |
Microstructure and Local Property Variability: How Filler Networks Create Local Weak Zones
The main danger of non-uniform filler dispersion is not cosmetic. It changes local mechanical behavior. Filler agglomerates can produce hard inclusions, weak interfaces and stress concentration. Filler-rich regions may increase modulus and hardness but reduce elongation and crack tolerance. Filler-poor regions may show weaker tear resistance, lower extrusion resistance and greater compression deformation. Local filler networks can increase hysteresis, friction or directional stiffness.
The polymer-filler interface decides whether reinforcement is transferred or whether debonding begins under load. Weak interfacial bonding may create microvoids during compression, sliding or cyclic strain. Cure-density variation may change rebound, compression set and local stress relaxation. Particle orientation or short-fiber orientation can produce local anisotropy, so a seal section responds differently in radial, axial or circumferential directions. Residual stress from molding and cooling can further bias crack initiation.
These effects do not always appear as large visible defects. A low-magnification microscope may not reveal nano- or micron-scale filler-network variation, while the seal still shows local modulus variation or fatigue sensitivity. For critical seals, a defect is not only a visible particle cluster; it can also be a local microstructural state that changes compression recovery, friction or contact pressure.
Table 2. Microstructural Features and Local Property Variations
| Microstructural Feature | Expected Property Variation | Seal-Level Consequence | Possible Failure Mode | Confirmation Method |
| Filler agglomerate | Hard inclusion | Stress concentration | Crack start | Microscopy/SEM |
| Filler-rich region | High local modulus | Pressure peak | Scuffing or split | Hardness map |
| Filler-poor region | Low stiffness | Low contact pressure | Microleakage | Indentation test |
| Weak interface | Poor load transfer | Debonding site | Fatigue crack | SEM/EDS |
| Local network | High hysteresis | Heat and friction | Wear patch | DMA mapping |
| Microvoids | Low strength | Path formation | Leakage | Micro-CT |
| Cure variation | Recovery change | Set variation | Pressure decay | Cure curve |
| Particle orientation | Directional modulus | Uneven response | Edge failure | Image analysis |
From Local Property Variation to Seal Performance: Contact Pressure, Wear and Leakage Path Formation
Local property variability becomes a sealing problem when it changes contact pressure. A seal may have the same nominal squeeze around the entire circumference, but local modulus variation changes how that squeeze is converted into pressure. A high-modulus patch may create a local pressure peak, raise insertion force, damage the mating surface or interrupt smooth contact. A low-modulus patch may compress too easily, recover slowly or extrude into a gap.
Compression-set variation is especially important because the area with poorer recovery may lose pressure first after thermal cycling or long-term compression. Rebound variation affects dynamic following in lip seals and moving interfaces. Local friction variation can create uneven sliding wear, stick-slip or heat generation. Filler agglomerates near the contact surface can behave as crack-initiation sites. Filler-rich brittle regions may fracture under repeated deformation, while filler-poor soft zones may deform into an extrusion gap.
The risk is amplified at seal corners, lip edges, parting lines and flow-end areas. O-rings may translate local stiffness into circumferential pressure variation. Rectangular seals and gaskets may show face-contact discontinuity. Dynamic seals may wear faster where friction and filler distribution are uneven. Average leakage data can hide early local damage until cycling exposes the weak path.
Table 3. Local Property Variability and Seal-System Risk
| Local Variation | Mechanical Effect | Contact-Pressure Effect | Possible Failure Mode | Recommended Verification |
| High modulus zone | Local stiffness rise | Pressure peak | Assembly damage | Pressure map |
| Low modulus zone | Over-compression | Low recovery | Microleakage | Local indentation |
| Surface agglomerate | Hard asperity | Contact disruption | Wear or crack | Surface microscopy |
| Poor recovery zone | Set growth | Pressure loss | Delayed leak | Compression set map |
| High friction patch | Sliding resistance | Uneven heat | Dynamic wear | Friction test |
| Brittle rich zone | Low elongation | Crack sensitivity | Fatigue split | Tear test |
| Soft poor zone | Low reinforcement | Extrusion tendency | Nibbling | Gap test |
| Orientation band | Directional stiffness | Pressure bias | Edge failure | Section analysis |
Characterization and Benchmark Testing: From Microstructure to Finished-Seal Evidence
A useful validation path begins with records. Raw material batches, filler content, compound formulation, mixing energy, mixing time, mixing temperature, Mooney viscosity and cure curves provide process evidence. They do not show every local defect, but they identify whether the compound was produced within a defined processing window.
Microstructural characterization adds spatial evidence. Optical microscopy can reveal large agglomerates or voids. SEM and SEM/EDS can evaluate particle clusters, interface features and local composition. Micro-CT can detect internal voids or inclusions. Image analysis can estimate agglomerate size distribution, with attention to sample preparation, cutting direction and scale effect.
Local property evaluation should follow. Hardness mapping, local indentation, micro-tensile testing, DMA, compression relaxation, compression-set testing, tear testing and friction or wear testing connect structure to behavior. Finished-seal evidence is still required: gland assembly, contact-pressure mapping, pressure hold, pressure decay, liquid or gas leakage and retesting after cycling. Average data supports screening; spatially resolved evidence supports failure prevention.
The validation path should progress from raw-material traceability and mixing records to cure-state evaluation, microstructural characterization, local property mapping, finished-seal assembly tests and leakage verification. Each level answers a different question. Process records can show whether the batch stayed inside the intended window, but they cannot prove local seal uniformity. Microscopy can reveal agglomerates or voids, but it cannot prove sealing function by itself. Finished-seal testing closes the evidence chain.
Engineering Controls and Material Selection: Building a Quality Chain from Mixing to Leakage Verification
Engineering control begins with formulation and mixing discipline. Filler addition sequence, moisture, surface-treatment stability, mixing energy, time and temperature should be defined as controlled windows. Mixer condition, masterbatch identity and final-mix traceability should be recorded. Filtering and contamination control reduce inclusions, but cannot replace dispersion verification.
Cure control must reflect part geometry. Thick and thin sections, corners, lip edges and flow-end zones may not see identical thermal history. Critical seals should use relevant sampling locations and section directions, not only the easiest cut. Local hardness checks or structural sampling must be linked to actual seal performance.
Design controls matter as much as material controls. Squeeze, gland fill, extrusion gap, surface finish and dynamic motion determine whether a local property variation becomes harmless scatter or a leakage path. The quality chain should connect filler system, hardness, cure state, dimensions, microstructure, local property data, contact-pressure mapping and finished leakage verification after relevant thermal, pressure or media exposure.
FMEA Risk Analysis: Failure Modes Caused by Hidden Filler-Dispersion Variability
The following FMEA uses no numerical RPN. Risk level depends on formulation, seal geometry, compression state, temperature, media, static or dynamic service and failure consequence.
Table 4. FMEA for Filler-Dispersion Variability in Rubber Seals
| Failure Mode | Cause | Local Effect | System Effect | Detection Method | Control Action |
| Filler agglomeration | Poor breakup | Stress concentration | Crack or leak path | Microscopy + local test | Tighten mixing energy |
| Filler-rich region | Segregation | High local modulus | Pressure peak or crack | Hardness mapping | Improve flow control |
| Filler-poor region | Uneven distribution | Low reinforcement | Extrusion or low pressure | Local indentation | Adjust mixing plan |
| Weak filler bonding | Moisture or poor wet-out | Debonding | Fatigue growth | SEM/EDS | Control filler condition |
| Mixing-energy variation | Equipment drift | Property scatter | Batch inconsistency | Process records | Monitor mixer state |
| Cure non-uniformity | Thermal gradient | Recovery variation | Pressure decay | Cure comparison | Validate cure profile |
| Local hardness variation | Filler or cure scatter | Stiff or soft patch | Uneven compression | Hardness map | Set local criteria |
| Local set variation | Cure or network shift | Uneven recovery | Delayed pressure loss | Recovery check | Validate by location |
| Crack initiation | Agglomerate or void | Early crack | Fatigue leak | Section microscopy | Inspect strain zones |
| Extrusion or wear | Soft zone or hard patch | Surface damage | Nibbling or wear | Gap/wear test | Control gland design |
| Uneven contact pressure | Modulus variation | Low-pressure segment | Unstable sealing | Pressure mapping | Use local limits |
| Hidden leakage path | Average hides weak zone | Path remains | Unexpected microleak | Leakage + mapping | Correlate local data |
Conclusion: Local Microstructure Determines Local Sealing Reliability
Non-uniform filler dispersion is not only a material-uniformity issue. It can become local modulus variation, hardness variation, recovery loss, friction change, crack initiation, extrusion sensitivity or a hidden leakage path. Actual reliability depends on filler type, filler surface treatment, agglomeration, polymer-filler interaction, mixing control, cure uniformity, seal geometry, local compression state, temperature, media, static or dynamic loading and finished-seal leakage behavior. Average hardness, tensile strength and compression set can show the general compound trend, but they cannot prove local performance consistency along the full sealing path. Critical seals should therefore link microstructural evaluation, local property mapping, contact-pressure evidence and finished-seal verification.
FAQ: Filler Dispersion and Local Performance in Rubber Seals
Q:What does poor filler dispersion mean in a rubber seal?
A:Poor filler dispersion means the filler is not adequately broken down or uniformly embedded in the polymer matrix. It may appear as agglomerates, filler-rich regions, filler-poor regions or weak interface zones. The issue must be confirmed by suitable microstructural and local property evidence.
Q:Can filler agglomeration cause local leakage without changing the average hardness?
A:Yes. A localized agglomerate can create a stress concentration, hard spot, surface discontinuity or crack-initiation site while the average hardness remains within specification. Leakage risk depends on where the defect lies relative to the sealing contact path.
Q:How does filler dispersion affect compression set and contact pressure?
A:Non-uniform dispersion can create areas with different recovery and local stiffness. Some zones may retain deformation more strongly, while others redistribute pressure unevenly. Compression set should therefore be interpreted with contact-pressure evidence and seal geometry, not as a standalone indicator.
Q:Which methods can reveal local filler-rich and filler-poor regions?
A:Optical microscopy, SEM/EDS, micro-CT, image analysis, hardness mapping, local indentation and micro-mechanical testing can all contribute. No single method proves the complete condition. The method must match the defect scale, material type, section direction and failure question.
Q:Can a rubber compound pass tensile testing but still fail as a seal?
A:Yes. Tensile testing measures a prepared specimen, often as an average material response. A molded seal can still fail if local filler distribution, cure state, geometry, friction or contact-pressure distribution creates a weak sealing segment that the tensile specimen did not represent.
Q:How does non-uniform filler dispersion affect dynamic seal wear?
A:Dynamic seals are sensitive to local friction, modulus and surface integrity. A filler-rich hard patch can increase abrasive interaction, while weakly bonded particles may debond and create wear debris. Confirmation requires wear testing and surface inspection under relevant motion and media conditions.
Q:Should local property mapping be required for every rubber seal?
A:Not for every seal. The need depends on application risk, seal geometry, failure consequence, compound complexity and historical process stability. For critical seals, local mapping is valuable because average hardness and tensile data may miss the weak zones that control leakage or durability.
Post time: Sep-10-2026