
Executive Summary
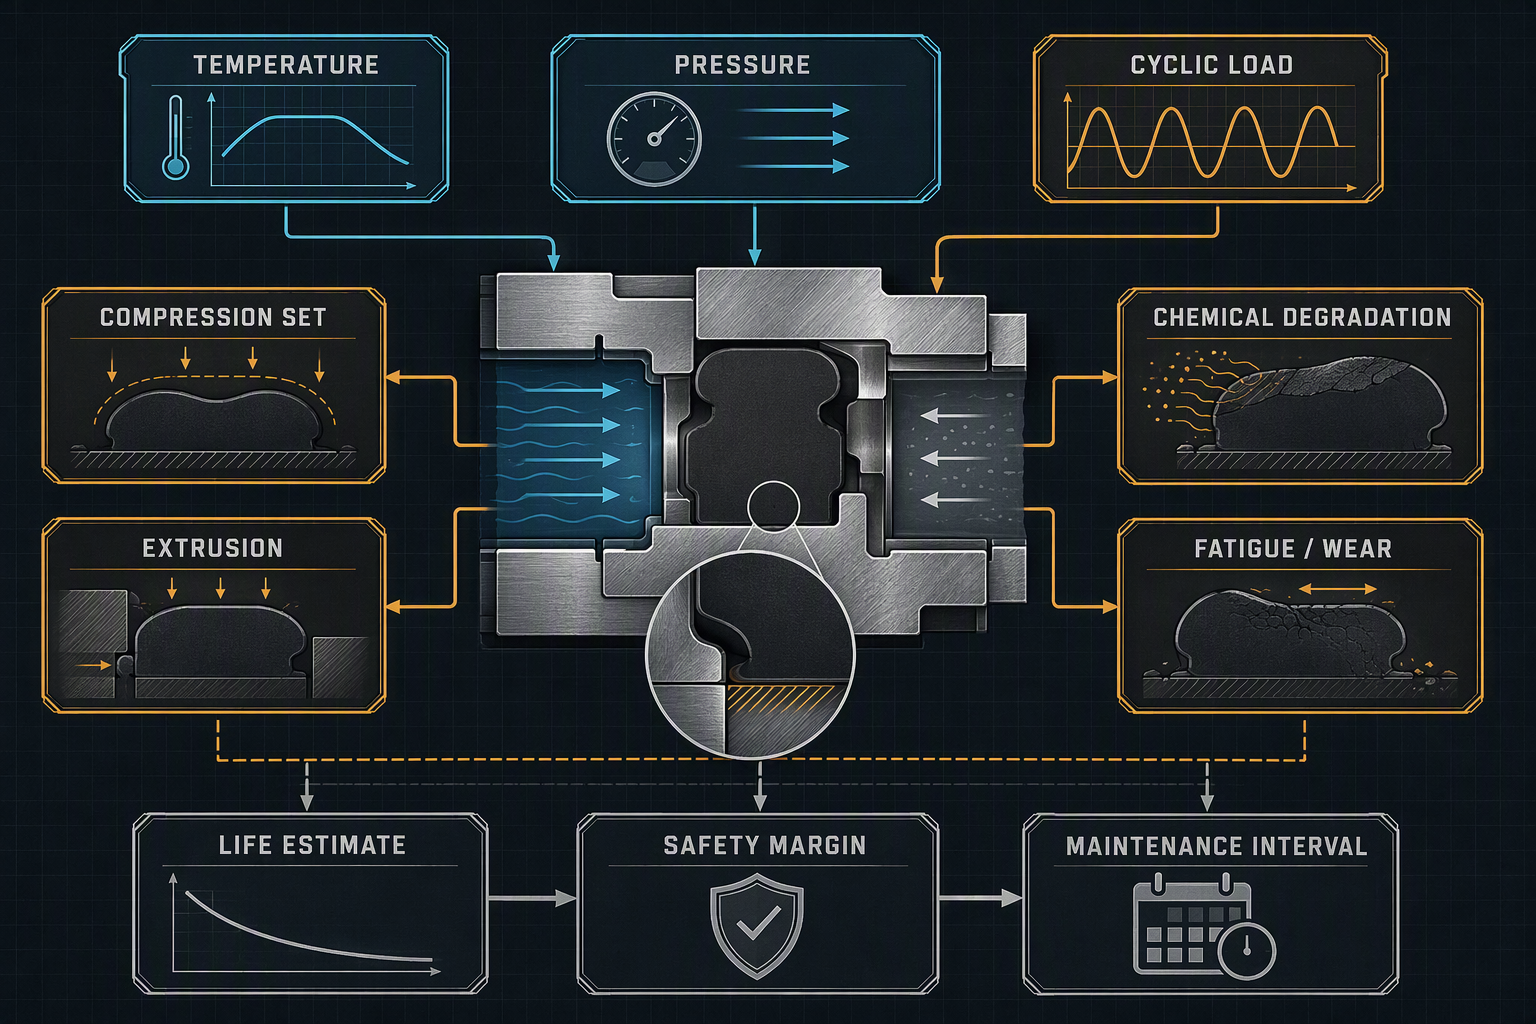
Seal life prediction estimates when a sealing system may approach a defined failure boundary under a specified combination of material, geometry, temperature, pressure, medium, motion and load history. It is not a universal calendar value: the same compound can show different life when compression, pressure differential, chemical exposure or cycling changes.
Relevant mechanisms include compression set, stress relaxation, thermal aging, chemical swelling or degradation, extrusion, wear, fatigue cracking, permeation and particle shedding. They can compete or interact. A credible model requires a traceable failure criterion, test condition and post-test inspection.
Design life, demonstrated test life, model projection, engineering estimate and maintenance interval must remain separate. Accelerated data support decisions but do not automatically equal field life.
Seal Failure Mechanisms
Compression set is permanent loss of recovery after compression and dwell; stress relaxation is decreasing sealing force while deformation remains. Thermal aging changes modulus and recovery through temperature-driven reactions. Chemical swelling changes dimensions and contact pressure, while degradation can embrittle, soften or crack the material.
Pressure and clearance may cause extrusion or nibbling. Relative motion produces abrasive or adhesive wear. Thermal and pressure cycling can initiate fatigue cracks at local strain concentrations. Permeation transports fluid through material without a visible crack, while particle shedding turns wear or cracking into a cleanliness risk.
These mechanisms should not be collapsed into material aging. High-temperature leakage may be compression set; high-pressure leakage may be extrusion; an intermittent moving leak may be wear; and a post-cycle leak may be fatigue or interface movement.
Table I: Seal Failure Mechanisms and Dominant Stressors
|
Failure mechanism |
Temperature effect |
Pressure effect |
Cyclic-load effect |
Typical symptom |
Recommended validation method |
| Compression set | Faster permanent deformation at elevated temperature | Changes contact reserve under load | Accumulates with dwell and cycling | Leakage after relaxation or restart | Compression-set test plus pre/post leakage |
| Stress relaxation | Sealing force decays faster when warm | Lower force reserve at pressure interface | Repeated thermal exposure accelerates loss | Slow leakage trend | Force-retention and thermal-aging study |
| Extrusion | Softening can increase gap entry | Differential pressure drives material into clearance | Pulses can enlarge damage | Nibbling, torn edge or extrusion gap | Pressure-cycle test with teardown |
| Chemical swelling | Temperature changes diffusion rate | Swollen geometry alters contact | Cycles can open cracks in swollen material | Dimensional change or softening | Actual-medium exposure and dimensional check |
| Abrasive wear | Heat lowers strength or lubrication margin | Contact load may increase | Motion accumulates wear debris | Wear track and rising leakage | Dynamic cycling with surface inspection |
| Fatigue cracking | Thermal aging reduces crack resistance | Pressure changes crack-tip stress | Repeated strain grows cracks | Delayed leakage after cycles | Thermo-mechanical cycling and microscopy |
A leakage trend is a symptom, not a mechanism. Temperature history, pressure state, motion profile and teardown morphology must be considered together before assigning the life-limiting cause.
Temperature Effects and Thermal Aging
Temperature changes chain mobility, modulus, recovery, reaction rate and medium diffusion. Elevated temperature may accelerate set, relaxation and chemical aging; low temperature may reduce conformability and recovery. Thermal cycling adds strain because seal and hardware may expand at different rates.
Arrhenius is most defensible when a thermally activated chemical-aging mechanism dominates and remains stable across the tested range. It is not a general model for wear, extrusion, pressure fatigue or installation damage. Time-temperature superposition describes some viscoelastic time-scale shifts only when material behavior remains stable.
Acceleration must remain below a boundary where material, medium, geometry or fixture fails by a mechanism absent in service. A few high-temperature points cannot support a multi-year projection. Numerical examples must identify material, dimensions, medium, temperature, indicator and method.
Pressure and Mechanical Load Effects
Pressure changes contact stress, squeeze reserve, extrusion tendency and local deformation. The relevant variable is pressure differential combined with clearance, groove geometry, backup support, temperature and modulus. Higher pressure may redistribute stress, load a backup ring, damage a groove edge or increase friction before visible extrusion.
Static pressure, pressure cycling, rapid ramps, reciprocating motion, rotary motion and thermo-mechanical cycling create different damage histories. Installation tolerance and flange or shaft movement can matter as much as nominal pressure. A pressure-hold result cannot be converted directly into dynamic or pulse life.
Record pressure range, ramp, dwell, temperature, motion, alignment and surface condition. These variables define model stress history and separate abnormal failures from wear-out.
Table II: Temperature, Pressure and Cyclic-Load Influence Matrix
|
Stress factor |
Primary physical effect |
Secondary effect |
Potential failure mode |
Required measurement |
Main modeling limitation |
| Temperature | Modulus and reaction-rate change | Diffusion and recovery change | Aging, set, hardening | Temperature history and material state | Mechanism may change with temperature |
| Pressure | Contact stress and deformation | Friction or gap entry | Extrusion, fatigue, leakage | Pressure trace and seal geometry | Nominal pressure hides local stress |
| Pressure differential | Net force across interface | Backup support loading | Extrusion, nibbling | Differential pressure and clearance | Boundary conditions may differ in field |
| Thermal-cycle amplitude | Repeated expansion and contraction | Interface movement | Fatigue, loss of contact | Cycle extremes, rates and dwell | Cycle count alone is incomplete |
| Pressure-cycle amplitude | Repeated mechanical strain | Joint and groove loading | Pulse fatigue, crack growth | Pulse trace and cycle count | Frequency can change heating |
| Actuation frequency | Motion and frictional heat | Lubrication and wear change | Dynamic wear, stick-slip | Speed, force or torque | High frequency may be unrealistic |
| Relative motion | Material removal and surface interaction | Particle generation | Abrasive or adhesive wear | Stroke, speed and surface finish | Static tests do not represent motion |
The life driver is usually a combination of stress factors. Temperature can alter modulus while pressure changes contact force, and cycling determines whether the resulting damage accumulates or recovers.
Cyclic Loading and Life Modeling
Cyclic loading includes thermal and pressure cycling, actuation, start-stop operation, vibration-induced micro-motion and repeated assembly. Each cycle requires amplitude, extremes, dwell, ramp, frequency and environment. “Cycle-to-failure” has no transferable meaning without these records.
Weibull or lognormal distributions can describe life scatter when sample size and censoring rules are adequate. Cycle-to-failure or S-N relationships may suit fatigue; cumulative damage requires assumptions about interaction; competing-risk analysis suits independent aging, wear, extrusion or chemical degradation.
Define the failure criterion before testing: leakage, force loss, friction, particles, cracks or functional loss. Record interruptions, censored samples and teardown, and report uncertainty and safety margin rather than only median life.
Accelerated Life Testing and Model Limitations
Accelerated life testing shortens a test by increasing temperature, pressure, exposure time, cycle frequency, actuation rate or load amplitude. It is useful only when the intensified condition remains related to the service mechanism; otherwise it measures a different failure mode.
Invalid acceleration includes field-absent chemical degradation at high temperature, unrealistic frictional heating at high frequency, abnormal extrusion at excessive pressure and fixture constraints that change hardware movement. Use multiple indicators when competing mechanisms are plausible.
An accelerated result is a laboratory observation; a model projection is mathematical extension; demonstrated life is supported only within the tested envelope; an engineering estimate includes assumptions and uncertainty.
Table III: Accelerated Life Test and Model Selection Guide
|
Test type |
Test purpose |
Acceleration variable |
Failure indicator |
Suitable model |
Main limitation and field correlation |
| Thermal aging | Assess heat-driven chemical change | Temperature and exposure time | Hardness, strength, set or leakage | Arrhenius when mechanism is stable | Needs field temperature correlation; not a wear model |
| Compression-set test | Measure recovery loss after dwell | Temperature, compression and dwell | Set, recovery force and leakage | Trend or distribution analysis | Specimen result may not represent full gland |
| Pressure-pulse test | Assess repeated pressure damage | Pressure amplitude and cycles | Leakage, extrusion, crack or deformation | Cycle-to-failure or Weibull | Pulse profile must match service |
| Thermal-cycle test | Assess interface and material cycling | Temperature range, rate and dwell | Post-cycle leakage and cracks | Cycle distribution or damage model | One cycle cannot prove long-term life |
| Dynamic wear test | Assess motion-related degradation | Speed, stroke, force and cycles | Wear, friction, particles and leakage | Wear-rate or life distribution | Surface and lubrication must correlate |
| Chemical immersion test | Screen medium compatibility | Temperature, concentration and time | Mass, dimensions, hardness and cracks | Exposure trend or competing risk | Material screen is not system life |
| Combined thermo-mechanical | Challenge interacting loads | Temperature, pressure and motion | Functional failure and teardown morphology | Mechanism-based or competing risk | Complex data needs strong traceability |
Model selection follows the failure mechanism and data structure. No listed model is universal, and an acceleration factor is not transferable without evidence that the field and laboratory mechanisms are related.
Data Interpretation and Maintenance Planning
Life data should be examined for early, random and wear-out failures. Leakage trend, contact-stress decay, friction, compression-set growth, particles and inspection findings can indicate degradation before functional failure. Retain sample, batch, material, geometry, medium, pressure, temperature, cycles, interruptions and teardown.
Maintenance planning may be calendar-, cycle-, condition- or risk-based. The interval should reflect actual temperature, pressure, medium, operating hours, start-stop frequency, equipment history and monitoring. Safety margin should cover model uncertainty, batch variation, detection limits and leakage consequence.
Laboratory life is not converted by dividing years by a factor. The interval is a decision based on evidence, field severity, inspection reliability and acceptable failure probability, updated by field data.
FMEA Risk Analysis
A life-prediction FMEA should include errors in the model as well as physical seal failures. Incorrect temperature acceleration, unrepresentative pressure, excessive cycle frequency, material batch variation, incomplete logging, an incorrect failure criterion and insufficient teardown can all create false confidence. A maintenance interval set too long can convert an uncertain estimate into an operational risk.
The RPN values below are illustrative engineering risk rankings, not field statistics or experimental results. Their purpose is to prioritize investigation, data improvement and corrective action.
Table IV: Seal Life Prediction FMEA and RPN Analysis
|
Failure mode |
Cause |
Local effect |
System effect |
Detection method |
RPN |
Corrective action |
| Incorrect temperature acceleration | Temperature changes mechanism | Wrong aging rate | False life projection | Mechanism review and multiple indicators | 180 | Reduce range and validate mechanism |
| Pressure not representative | Field clearance or differential differs | Different local stress | Unreliable model | Geometry and pressure comparison | 170 | Use representative boundary conditions |
| Cycle frequency too high | Unrealistic heating or dynamics | Artificial wear | Overly short life estimate | Thermal and motion monitoring | 160 | Match frequency or model heating |
| Mechanism changed during test | New crack, chemistry or extrusion mode | Non-comparable failure | Invalid extrapolation | Teardown and morphology review | 190 | Separate mechanisms and re-test |
| Material batch variation | Compound or hardness scatter | Different recovery or aging | Wide life distribution | Batch records and property checks | 150 | Stratify data and control batch |
| Incomplete data logging | Missing load or temperature history | Stress history unknown | Weak evidence | Record audit and sensor review | 140 | Use controlled data capture |
| Incorrect failure criterion | Criterion not linked to function | Premature or late failure call | Wrong release decision | Requirement and FMEA review | 185 | Define mechanism-based criterion |
| Maintenance interval too long | Uncertainty ignored | Degraded seal remains installed | Leakage or downtime | Trend review and risk analysis | 175 | Add margin and condition checks |
| Insufficient teardown | Failure morphology not recorded | Cause remains uncertain | Recurring failure | Teardown checklist and imaging | 135 | Require post-test inspection |
| Field condition not matched | Model uses nominal rather than actual duty | Severity misclassified | Maintenance error | Field data comparison | 180 | Update model with operating history |
The corrective action should address the physical mechanism, the model assumption and the decision rule. Lowering an RPN without improving evidence does not improve reliability.
Conclusion
Seal life prediction must begin with a defined failure mechanism and a traceable load history. Temperature, pressure, medium, compression, motion and cyclic loading should be evaluated together because each can change the effect of the others. Arrhenius analysis, time-temperature superposition, cycle distributions and competing-risk methods are tools for bounded questions, not universal answers.
Design life, demonstrated test life, model projection and field maintenance interval should remain separate statements. A defensible prediction includes acceleration limits, uncertainty, safety margin, post-test inspection and comparison with actual service conditions. The model should be updated as field data and failure records accumulate.
Engineering FAQ
Q:Why can seal life not be defined by a fixed number of years?
A:Because temperature, pressure, medium, compression, motion and cycle history vary between applications. A calendar value without a load envelope is not a transferable reliability statement.
Q:How do temperature and pressure interact to accelerate seal failure?
A:Temperature changes modulus, recovery and reaction rate, while pressure changes contact stress, deformation and extrusion risk. Their combination can produce a failure mode that neither variable would create alone.
Q:When is the Arrhenius model appropriate for seal life prediction?
A:It is appropriate when a thermally activated chemical-aging mechanism dominates and remains stable over the tested temperature range. It should not be used as a general model for wear, extrusion or pressure fatigue.
Q:Why can accelerated testing produce misleading life estimates?
A:The acceleration may create a different mechanism, such as abnormal chemical degradation, frictional heating or extrusion. A projection is valid only when laboratory and field mechanisms are demonstrably related.
Q:Which parameters should be recorded during a seal life test?
A:Record material and batch, geometry, medium, temperature history, pressure and differential pressure, compression, motion, cycle definition, frequency, failure criterion, interruptions, leakage trend and teardown findings.
Q:How should laboratory life data be converted into a maintenance interval?
A:Correlate the tested envelope with field severity, failure probability, monitoring capability and consequence of leakage. Apply an explicit safety margin and update the interval when operating or failure data change.
Post time: Aug-26-2026